Point Tracking
My friend Samuel Joseph was trying to track a multi-jointed
pendulum as part of a science-fair type project (the ASHSSS, or Alaska
High School Science Symposium). He didn't want a mechanical
tracker, because that would interfere with the pendulum's motion, so a
camera was the only way to go. He also wanted to make at least
several dozen runs, and capture the motion information multiple times
per second, so manual analysis (e.g., click the center of the pendulum)
wasn't possible.
So I wrote him a tiny little Linux program to do the following:
- Capture a frame from a video input device--in this case, a little
15fps 640x480 Labtec Webcam Pro, connected via USB 2.0. (Only $20 on
Amazon.com, and a pretty good picture!)
- Look for a particular color in that frame--the end of the
pendulum is painted hot pink. The color to look for, and the
selection tolerance can be set by the user. I found comparing
colors in RGB to not work very well, because a small shadow across the
target changes the brightness dramatically. Instead, I compare
colors in YUV color space, and weight down the Y compare
component.
- Find the center of mass of that color. This is a two-pass
method: first we estimate the overall frame center of mass, then we
window out a small region around the estimated center of mass and
recompute the center of mass. This is just a trimmed mean in 2D,
and works well to remove isolated outlier pixels.
- Write the center of mass to a file, if it really represents enough pixels to be a valid detection.
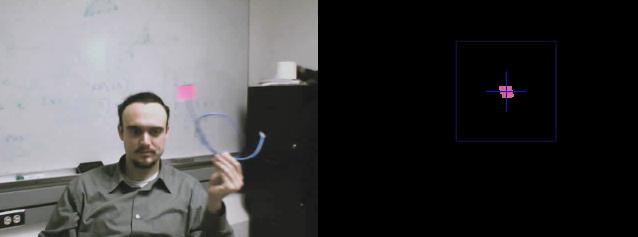
Here's an image of the program in action, tracking a pink Post-It (tm) note:

The program is currently only for Linux, but it should work with any webcam. You can:
The processing this program performs is to look for a target color,
which you can choose by clicking on the left part of the window, or by
passing an HTML-style color like "#ff00cc" on the command line. Pixels
from the webcam with that color are selected, and the center of mass of
that color is determined and displayed on the left.
The color selection tolerance can be adjusted by clicking in the right
part of the window: click toward the bottom for larger tolerance (more
pixels selected); toward the top for lower tolerance (fewer pixels
selected).
The output text file is called "points.txt", and is just 4 columns of numbers separated by tabs:
- Time, in seconds, since the first spot was found.
- X coordinate of spot, in onscreen pixels (0-640)
- Y coordinate of spot, in onscreen pixels (0-480)
- Size of spot, in pixels (0-10,000)
This file can be imported directly into MS Excel by setting the "column separator" to tabs.
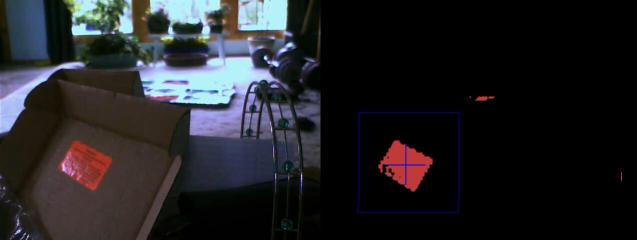
The program seems pretty robust to bad matches outside your main
object--here the false matches due to the Dance Dance Revolution
control pad on the floor are rejected as being too far from the center
of mass search rectangle:

Orion Sky Lawlor, 2005/12
Back to Orion's Oeuvre.
Back to Orion's Home Page.

